Grafana
Grafana is a tool to generate graphs and dashboards.
Configuration
See the documentation on configuring Grafana at: https://grafana.com/docs/grafana/latest/setup-grafana/configure-grafana/#override-configuration-with-environment-variables
Configuring Grafana Docker image
The Grafana configs on the Docker image are typically set using environment variables rather than using the configuration grafana.ini file. Environment variables for Grafana are all prefixed with GF_ followed by its section and key name all in uppercase.
Here are some common environment variables that are set on Grafana.
| Setting | Environment Variable | Example value |
|---|---|---|
| URL | GF_SERVER_ROOT_URL
|
GF_SERVER_ROOT_URL=https://grafana.example.com/
|
| Name | GF_DEFAULT_INSTANCE_NAME
|
GF_DEFAULT_INSTANCE_NAME=my-instance
|
| Updates & Telemetry | GF_SERVER_CHECK_FOR_UPDATES
|
GF_SERVER_CHECK_FOR_UPDATES=false
|
| Plugins to install | GF_INSTALL_PLUGINS
|
GF_INSTALL_PLUGINS=grafana-simple-json-datasource,https://github.com/cloudspout/cloudspout-button-panel/releases/download/7.0.23/cloudspout-button-panel.zip;cloudspout-button-panel,grafana-piechart-panel,https://github.com/grafana/piechart-panel/releases/download/v1.6.4/grafana-piechart-panel-1.6.4.zip;grafana-piechart-panelPlugins are semicolon delimited. Each plugin has a name and URL separated by a comma.
|
| LDAP | GF_AUTH_LDAP_ENABLED
|
GF_AUTH_LDAP_ENABLED=true
|
| SMTP | GF_SMTP_ENABLED
|
GF_SMTP_ENABLED=trueGF_SMTP_HOST=smtp:25
|
Random Notes
Pie Graph using MySQL
With the following query, I am able to generate a two column result set which I want to put into a pie graph.
SELECT requested_cpu, COUNT(requested_cpu) FROM `jobs` GROUP BY requested_cpu ORDER BY `COUNT(requested_cpu)` DESC
However, the Grafana Pie Graph plugin requires the result to be a time series. To work around this, add the timeseries with the current timestamp and ensure that the metric is a char type.
SELECT now() as time_sec, COUNT(requested_cpu) as `value`, CONVERT(requested_cpu, char) as metric
FROM `jobs` WHERE   $__timeFilter(started)
GROUP BY requested_cpu
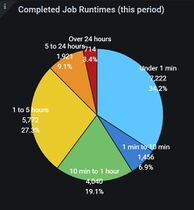
Custom Colors in Pie Graph
Specify custom colors for each series by editing the JSON data directly. There should be an aliasColors field which needs to be populated. For example:
"aliasColors": {
    "1 min to 10 min": "#3b7dd0",
    "1 to 5 hours": "#e8cb2a",
    "10 min to 1 hour": "#73bf69",
    "5 to 24 hours": "#e8912a",
    "Over 24 hours": "#b21c1c",
    "Under 1 min": "#5fc5ff"
  },
|
Ordering Series
When making a line graph, I wanted to order series in a specific order. The best way I found was to just have multiple queries selecting specific series in a particular order.
Tips
Reducing a long chain of conditions
Are you writing Influx queries like:
SELECT something FROM somewhere
WHERE thing = 'that' OR thing = 'it' OR thing = 'those' OR ....
Why not group them with pattern matching instead:
SELECT something FROM somewhere
WHERE thing =~ /^(that|it|those|...)$/
See also
| ||||||
